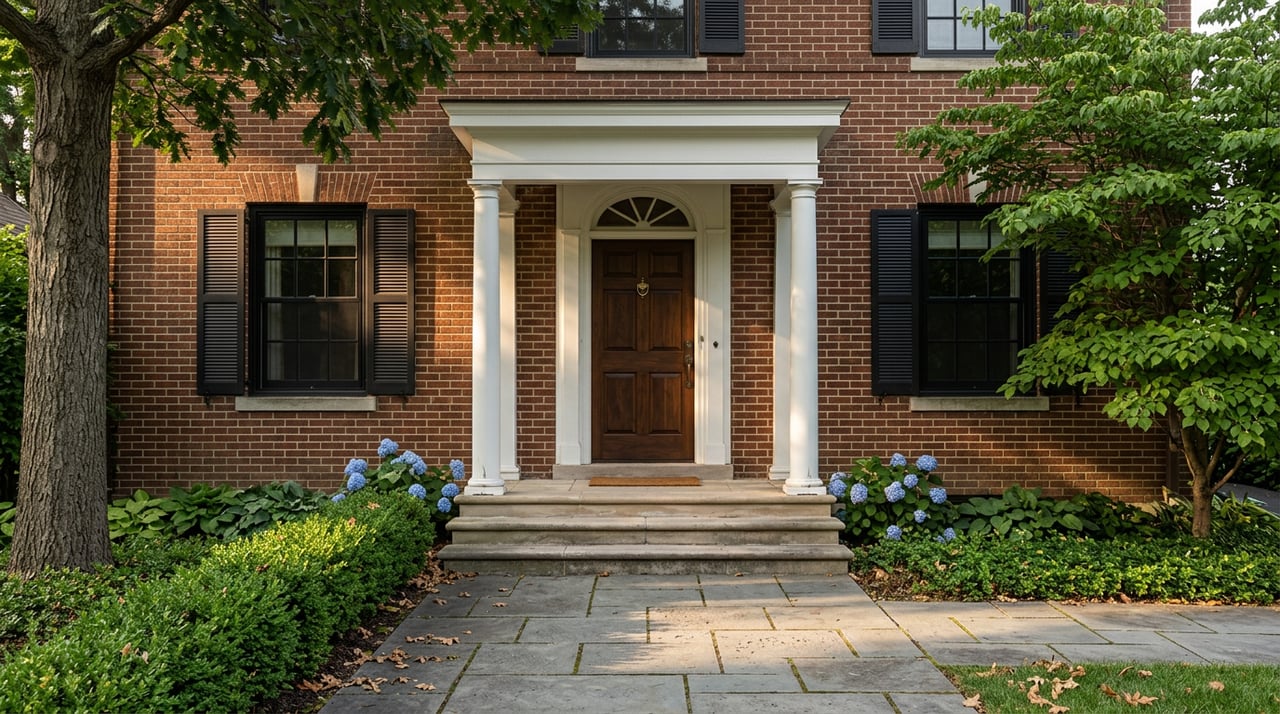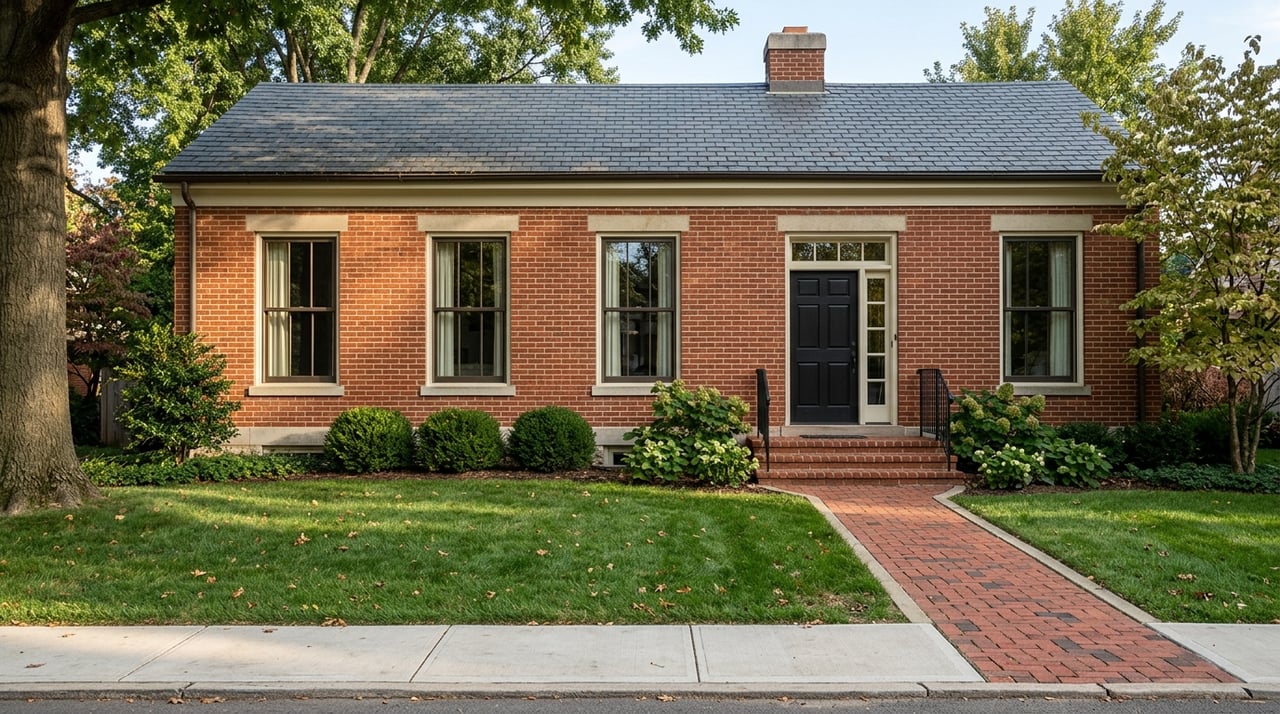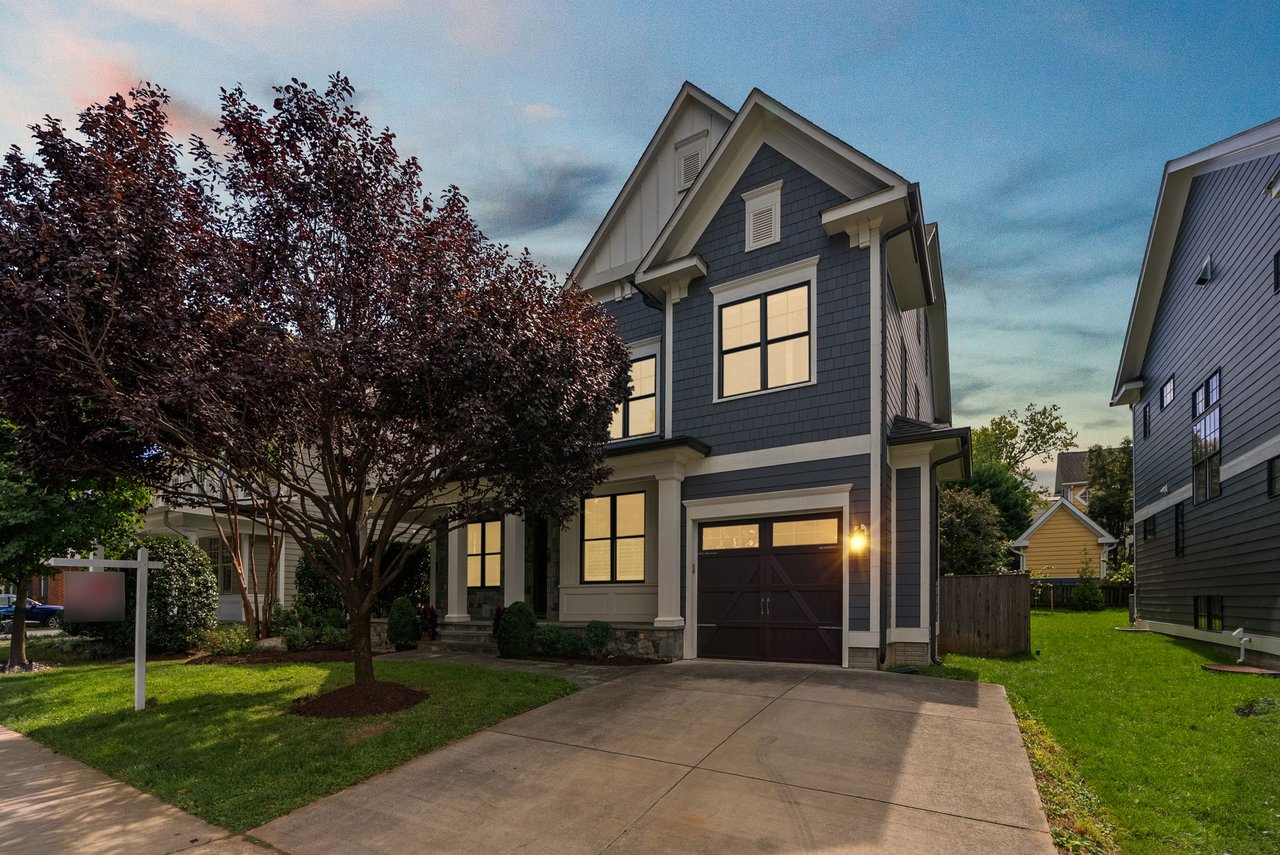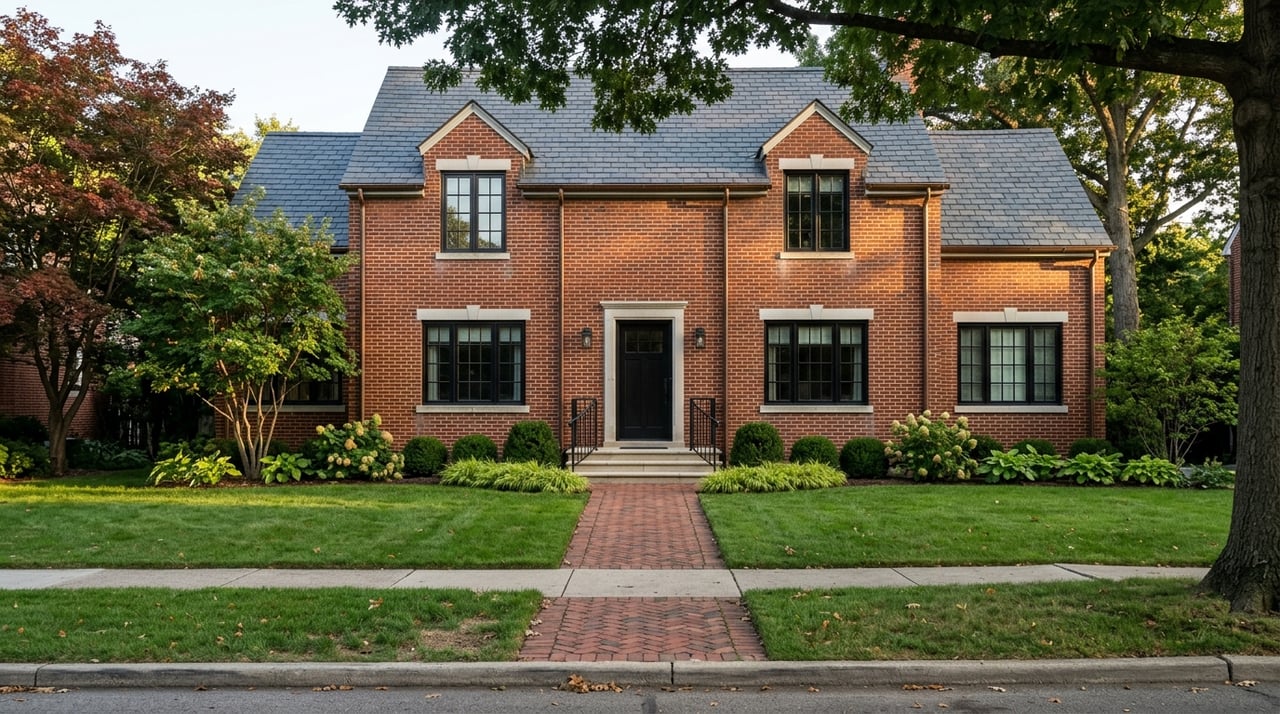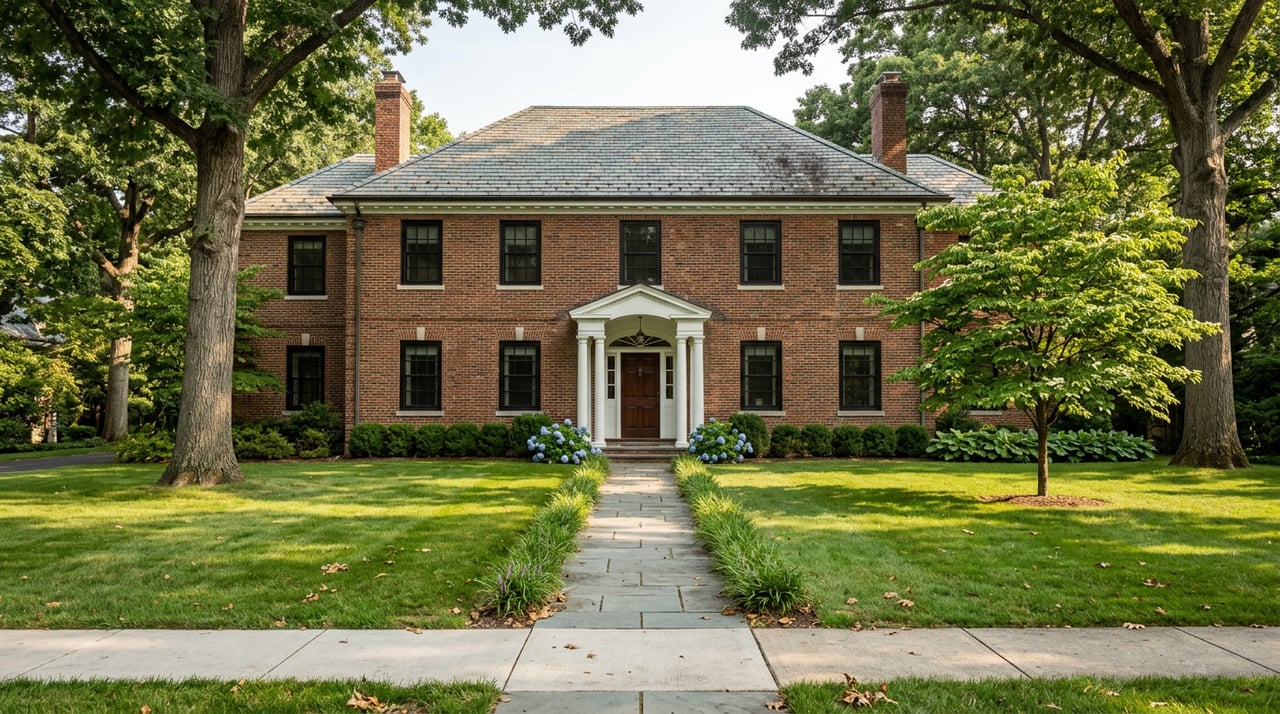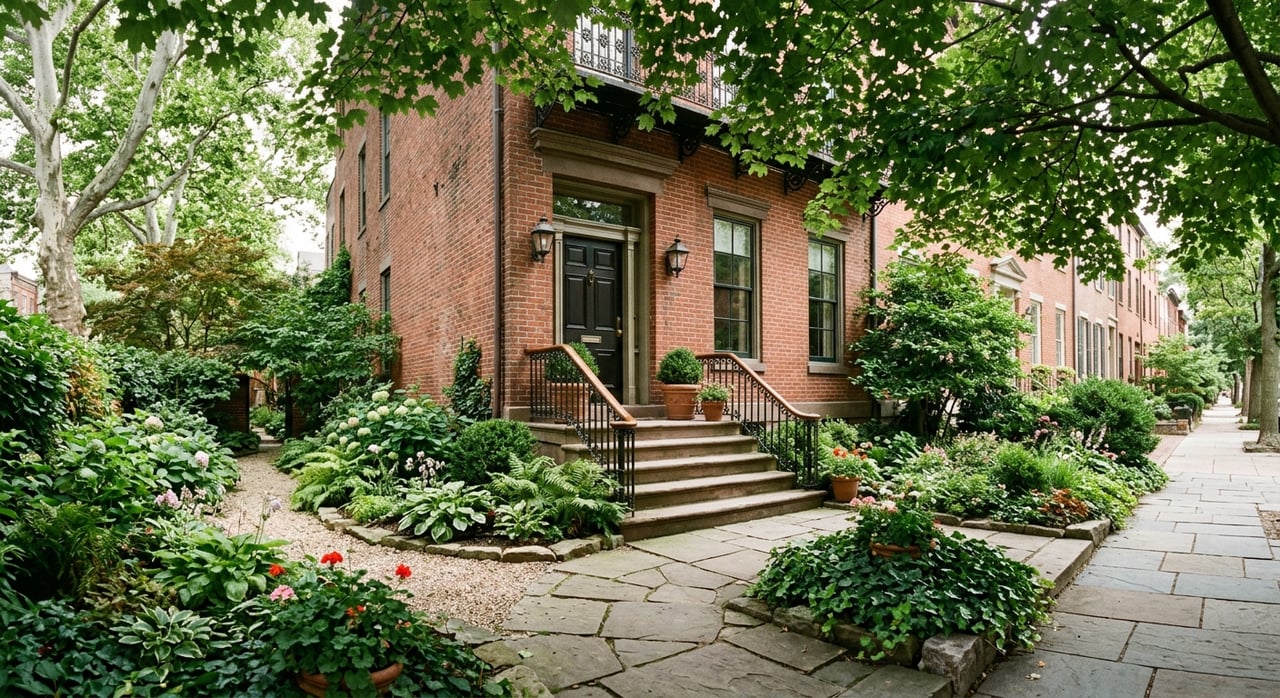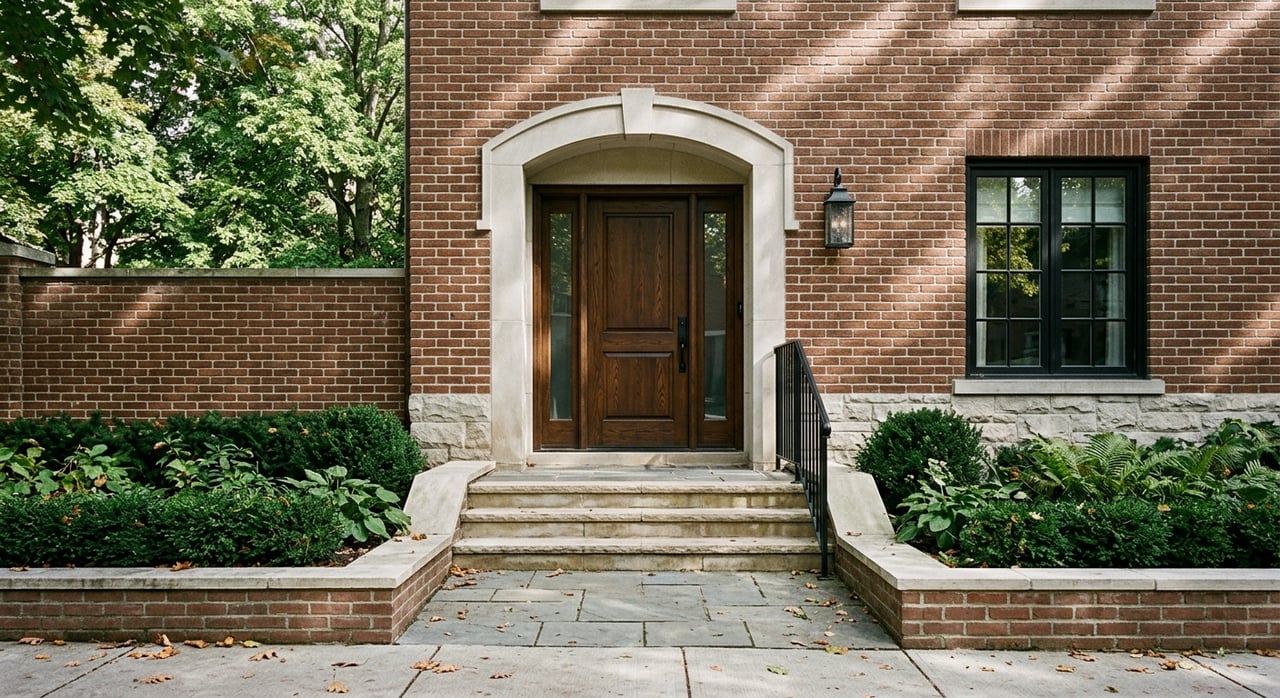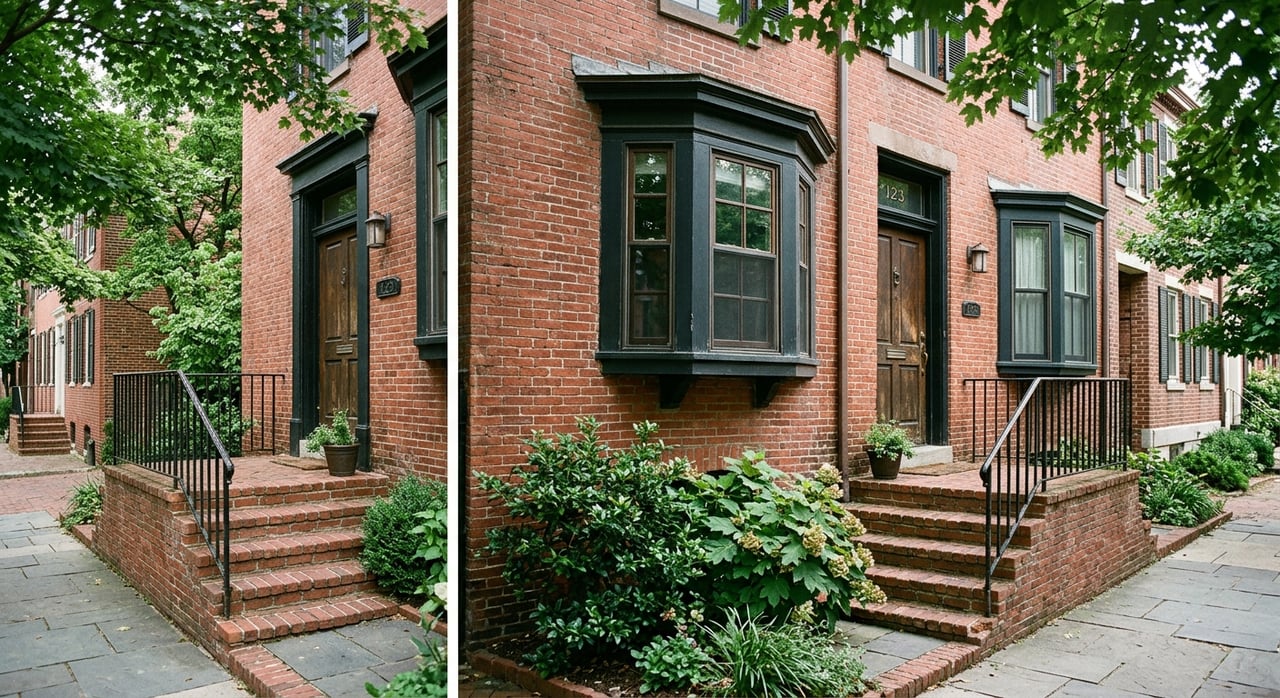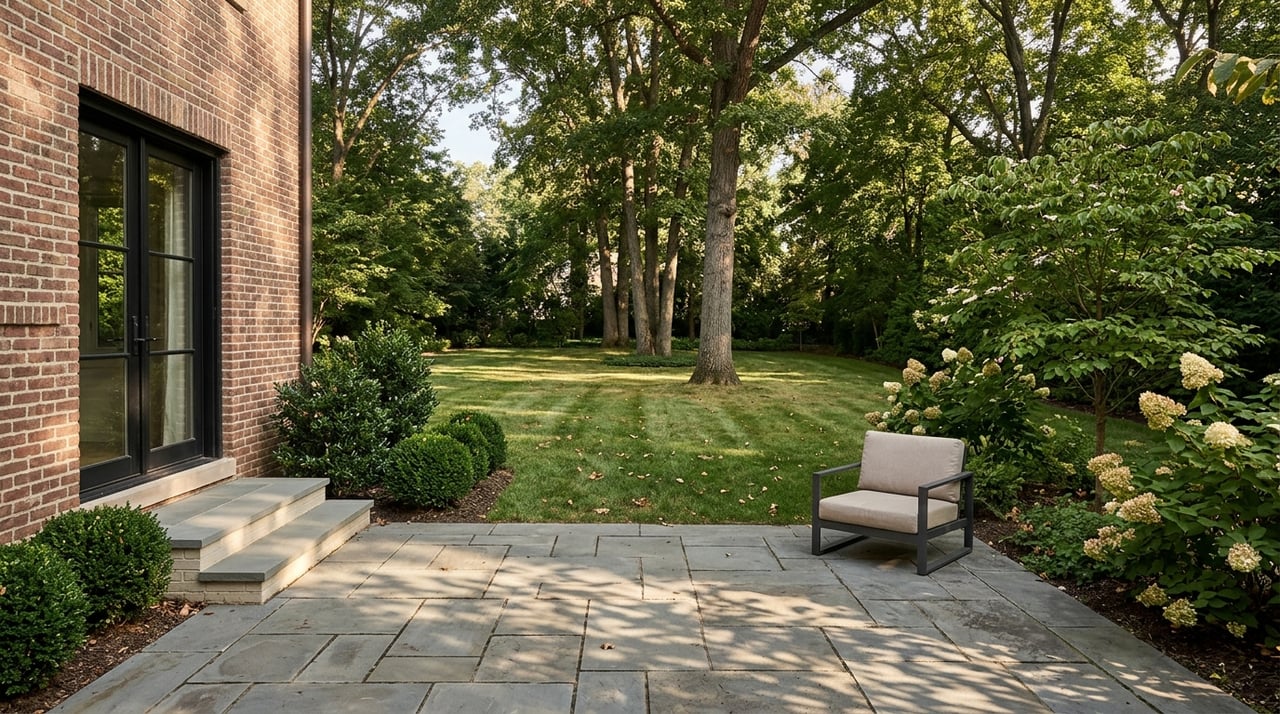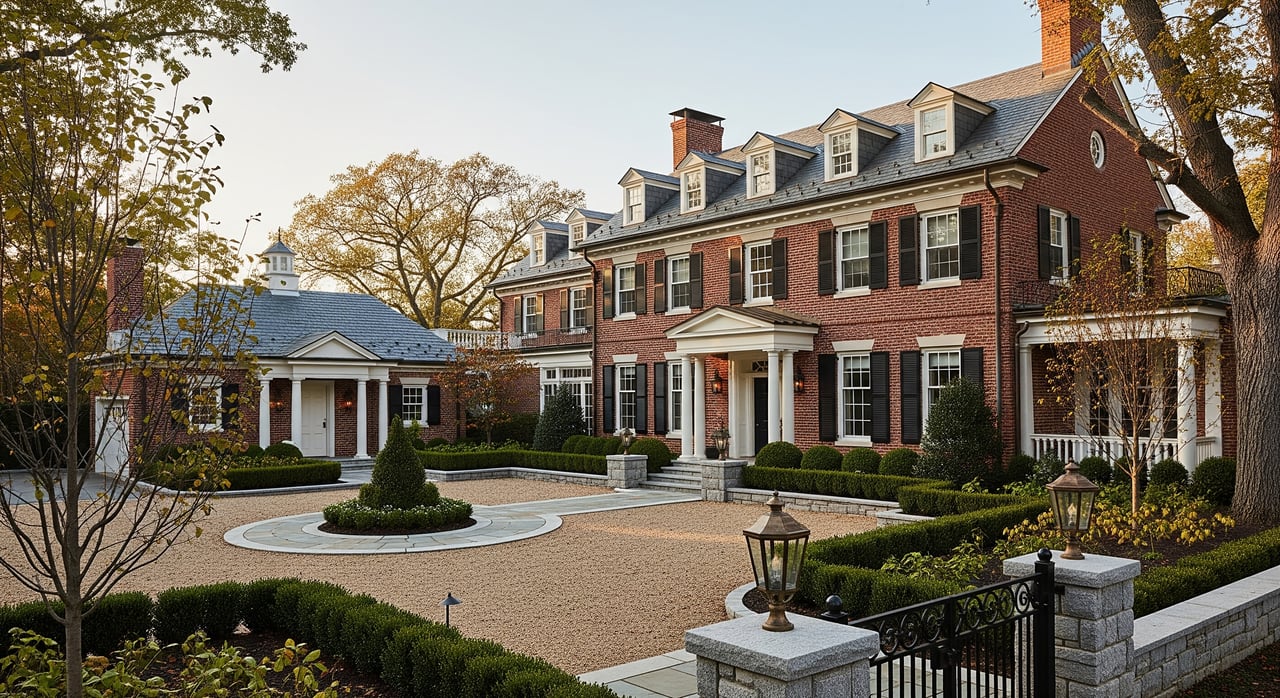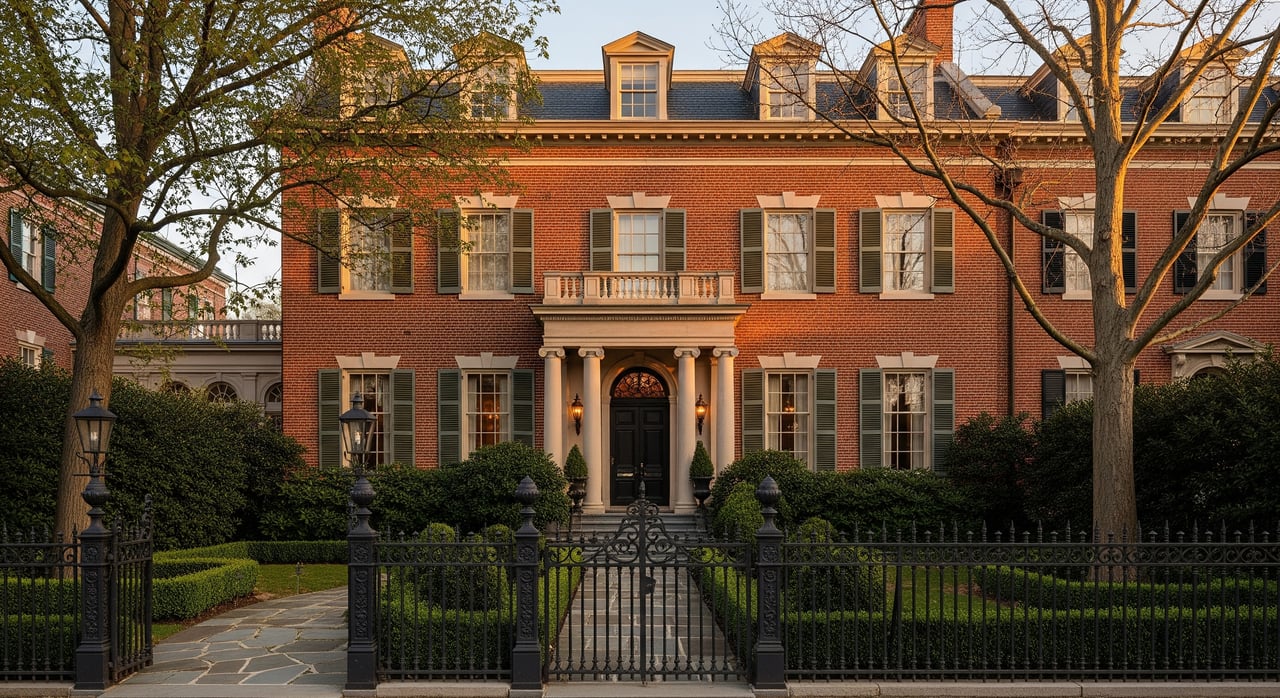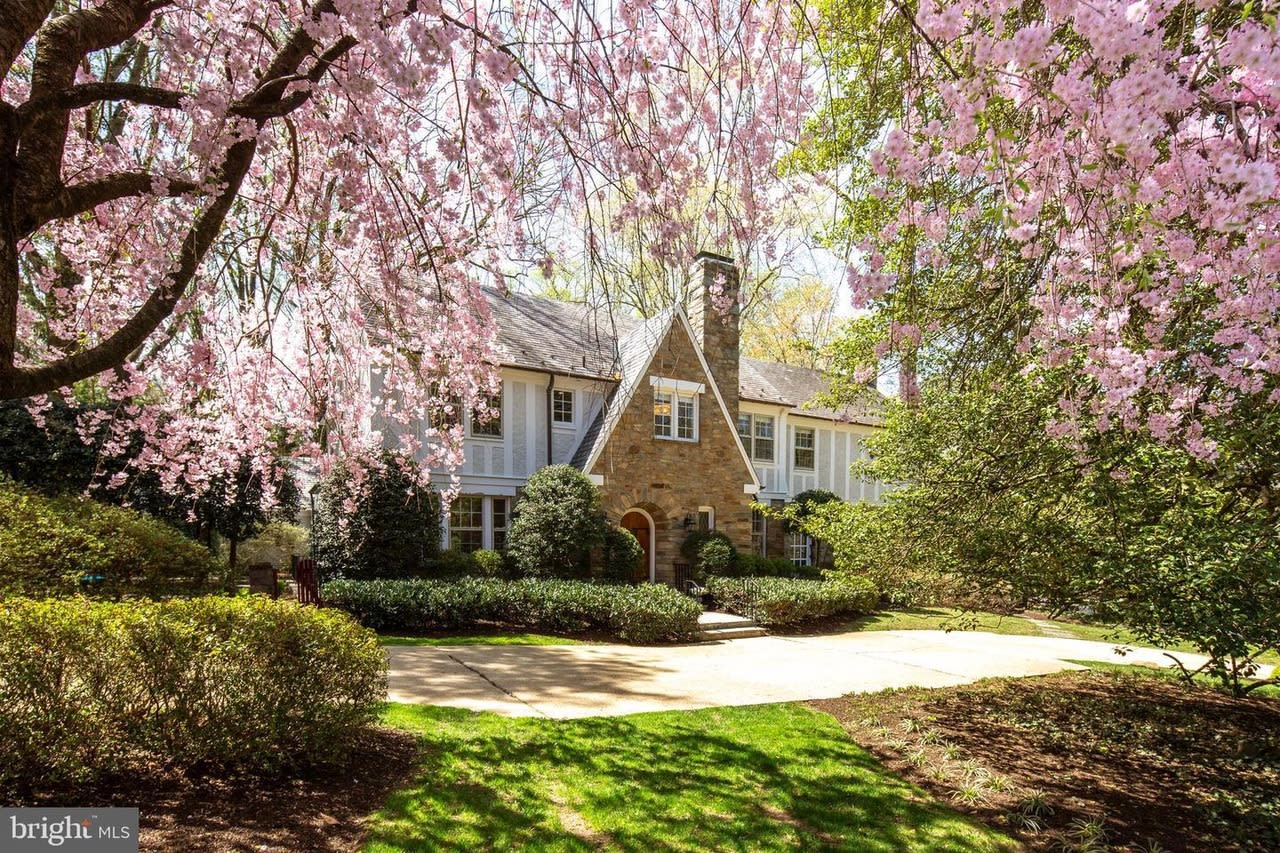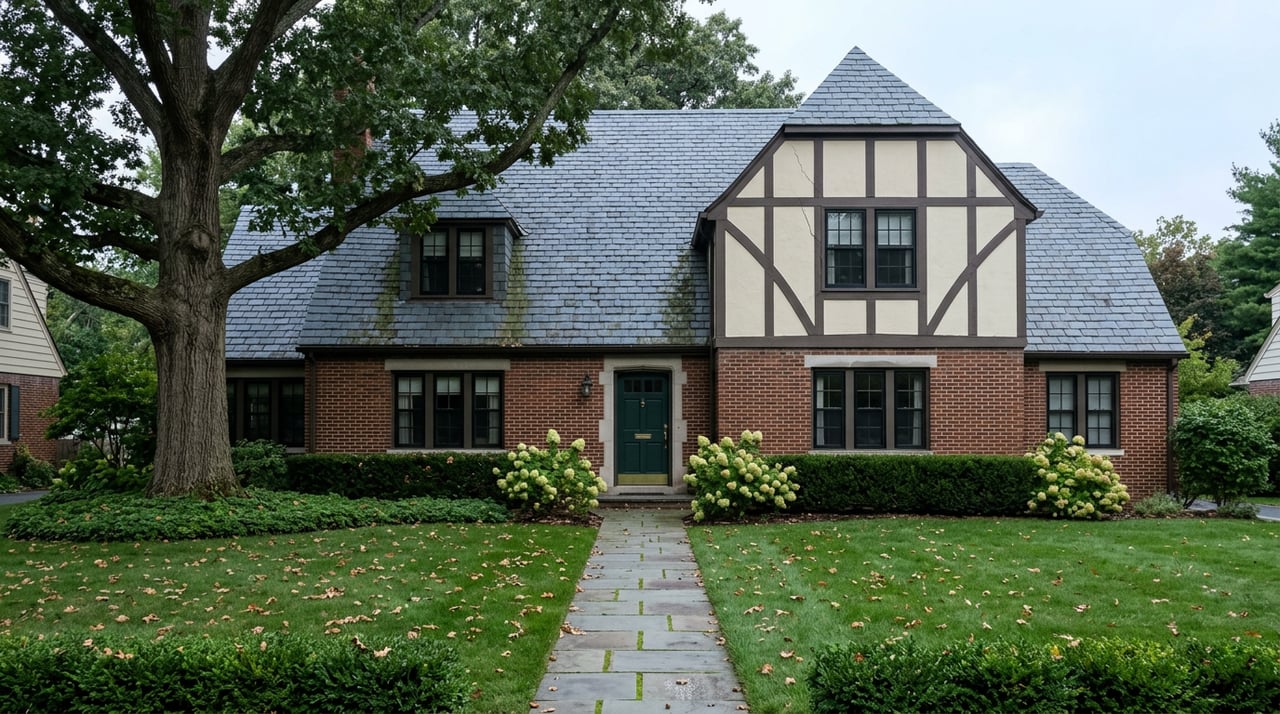
In May 2026, a Bethesda-area brokerage's website listed six active properties in Westmoreland Hills. One was a colonial on Abingdon Road. Another was a stone-and-shingle traditional on Cape Cod Court. A third was a 28,700-square-foot parcel on Massachusetts Avenue asking $14,995,000, a price that has more in common with a small office building than with the $2 million homes sitting a few blocks away.
That single listing sat inside the same six-property snapshot used to calculate the neighborhood's average days on market and average price per square foot. When a market this small tries to describe itself with one number, one property can carry the whole conversation.
This is the part that gets lost when buyers compare a neighborhood's median price against the portal listing next door. Westmoreland Hills does not sell enough homes in a given year for its averages to behave the way averages do in a larger market. Understanding that is more useful than memorizing the median itself.
A Market of Nineteen Sales
Start with the full calendar year. In 2025, Westmoreland Hills recorded 19 home sales, all of them detached houses, at a median price of about $1.76 million. The average sale price for that same year came in higher, around $1.93 million. Homes sold at 98.5 percent of their original list price, and the average time on market was 17 days.
A gap of nearly $170,000 between the median and the average in a market of only 19 transactions is not a coincidence. It means a small number of higher-priced sales pulled the average up while the bulk of transactions clustered closer to the median. In a market with a thousand annual sales, a handful of outliers barely move the needle. In a market with 19, they do most of the work.
That is the pattern to watch for anywhere sales volume is this thin. The number itself is accurate. What it represents shifts depending on which homes happened to close that year.
What Six Listings and One Skyline-Priced Parcel Can Do
The clearest illustration came five months later. A market snapshot dated May 17, 2026 showed six active Westmoreland Hills listings with a combined average of $542.39 per square foot and an average of 35 days on market, more than double the 17-day average from the full prior year.
Look at what made up that snapshot. The Massachusetts Avenue parcel had been on the market 57 days. A seven-bedroom, 6,328-square-foot home on Cape Cod Court had been listed 75 days. Meanwhile, more typically sized homes in the same snapshot, a five-bedroom on Falmouth Road and a colonial on Abingdon Road, had been on the market 25 and 31 days respectively, well inside the neighborhood's normal rhythm.
The math is straightforward once you separate the properties. Two unusual listings sitting for 57 and 75 days pulled the six-property average up to 35 days, even while the ordinary colonials in the same batch were moving in roughly a month or less. That is not a neighborhood slowing down. It is two outsized properties, one of them more consistent with an estate lot or development-scale listing than a typical family home sale, sitting in a pool small enough that they define the average by themselves.
For comparison, Bethesda as a whole recorded a median time to contract of 16 days across 97 closed sales in the 30 days ending August 1, 2026. Westmoreland Hills, in the same broad window, would have looked like it was moving twice as slowly, and the difference had nothing to do with buyer demand for the neighborhood.
| Metric | Full-Year 2025 | May 2026 Snapshot | Bethesda-Wide (30 days ending Aug 1, 2026) |
|---|---|---|---|
| Homes sold or listed | 19 sold | 6 listed | 97 closed |
| Median price | $1.76M (sold) | $2.417M (list) | $1.275M (sold) |
| Average days on market | 17 days | 35 days | 16 days (median) |
| Price per square foot | not separately reported | $542.39 | $434 (as of July 2026) |
The Premium That Actually Holds Up
Not every number in Westmoreland Hills is this noisy. Price per square foot tends to be a steadier measure than days on market or a single month's median, because it is less sensitive to which two or three homes happen to close in a given window. At $542.39 per square foot in the May 2026 snapshot, Westmoreland Hills sat well above the broader Bethesda figure of $434 per square foot recorded as of July 2026, a gap of roughly 25 percent.
That premium is consistent with what the neighborhood is actually selling: larger lots, mature trees, and a mix of traditional colonials, Tudors, and brick traditionals rather than the townhouse and condo inventory that pulls down a citywide average. Buyers comparing Westmoreland Hills against downtown Bethesda or against DC neighborhoods across the line should expect to pay more per square foot here, and that premium reflects lot size and architectural character more than it reflects any single month's sales activity.
Lot size and condition also explain why two homes at similar list prices in this neighborhood can carry very different value. A well-maintained colonial on a standard lot and a larger custom build on a hillside parcel are technically the same zip code, but they are not the same product, and treating them as interchangeable comparables is where buyers get into trouble.
What to Ask Before You Trust the Number
A published median or average is a starting point, not a verdict. In a market where the full year's sales fit on two hands, a few questions matter more than the headline figure:
- Ask what specific homes are behind this month's average, not just the average itself. A 35-day average built from two unusual listings and four ordinary ones tells a different story than 35 days spread evenly across six comparable homes.
- Separate detached, standard-lot sales from anything unusual, whether that is a double lot, a teardown, or a parcel with commercial-scale square footage. Blending them into one median distorts both sides of the comparison.
- Weight price per square foot more heavily than days on market when the sample is this small. It moves less with each individual sale and gives a steadier read on where the neighborhood actually sits relative to Bethesda overall.
- Ask for the trailing 12 months of actual closed sales, not a snapshot of whatever happens to be active this week. Nineteen closings spread across a year is a far better read than six listings caught mid-cycle.
A Few Questions Worth Asking
Is Westmoreland Hills more expensive than Bethesda overall? On a price-per-square-foot basis, yes. The neighborhood's $542.39 per square foot in the May 2026 snapshot ran roughly 25 percent above the broader Bethesda figure of $434 recorded as of July 2026, a premium tied to lot size and architectural character rather than any single month's transactions.
Does a longer average days-on-market number mean the neighborhood is slowing down? Not automatically. The jump from a 17-day average across 2025 to a 35-day average in the May 2026 snapshot traced back to two unusually large or high-priced listings sitting longer than the typical colonials around them, not to a broad shift in buyer demand.
How many homes actually sell in Westmoreland Hills in a typical year? Nineteen closed in 2025, all detached houses. That volume means buyers and sellers should expect thin inventory and should be cautious about drawing conclusions from any single month's activity without checking what specific properties are behind it.
Numbers like these are useful, but only when someone has actually looked at what is behind them. That is the work we do before we ever put a number in front of a client, whether you are comparing Westmoreland Hills against a home across the DC line or trying to figure out what a specific listing's time on market actually means for your offer.
If you are weighing Westmoreland Hills against another close-in neighborhood, or trying to make sense of a listing that has been sitting longer than you expected, Jack Realty Group can walk through the actual comparable sales with you, not just the headline figure. Book a neighborhood consultation and we will pull the real numbers behind whatever you are looking at.